Home Page
Overview
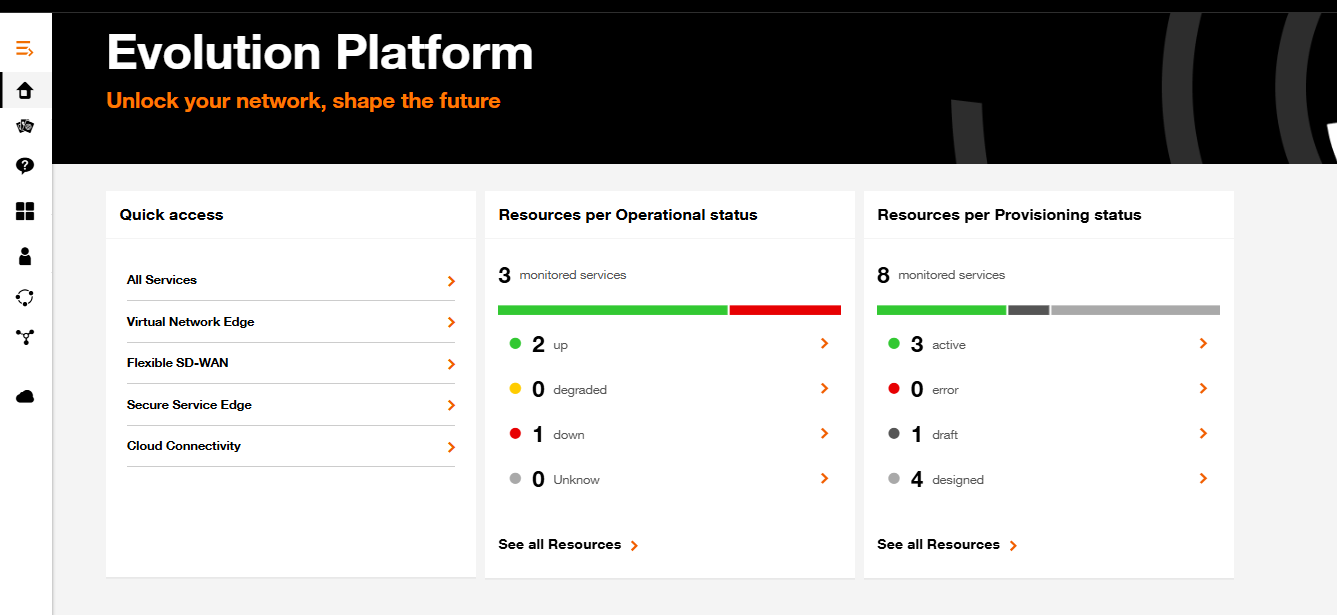
The Evolution Platform home page gives a quick status overview of your monitored services resources and a set of shortcuts to the most common service areas.
The page is organized into three main panels:
- Quick access (left)
- Resources per Operational status (center)
- Resources per Provisioning status (right)
Panel contents are live and reflect the current state of monitored resources. Use the arrows and links to drill down to filtered lists or to the full inventory.
Quick access
Purpose
- Fast navigation to frequently used service categories.
How to use
- Click any item to open the details or list view for that category.
- The chevron (arrow) on the right of each row indicates a clickable navigation action.
Resources per Operational status
Purpose
- At-a-glance view of the operational health of monitored resources.
Top summary
- A small header shows total monitored services (e.g., "3 monitored services").
Status bar
- A horizontal color bar gives a quick visual summary of the distribution across statuses (green, yellow, red, gray).
Status rows and meaning
- 🟢 Up — Number of resources currently operational (example: 2)
- 🟡 Degraded — Resources experiencing reduced functionality (example: 0)
- 🔴 Down — Resources currently unavailable (example: 1)
- ⚪ Unknown — Status unknown or not reported (example: 0)
How to use
- Click a status row (or the arrow at the right) to view the list of resources filtered to that status.
- Use the bar or the counts to prioritize investigation (red/down resources first).
- Click "See all Resources" to open the Global Inventory.
Resources per Provisioning status
Purpose
- Shows where resources sit in the provisioning lifecycle (design, draft, active, error).
Top summary
- Displays the total number of resources being tracked for provisioning (example: "8 monitored services").
Status bar
- Horizontal bar shows proportions for each provisioning state: active = green, error = red, draft = dark gray, designed = light gray.(See in Screenshot)
Provisioning statuses and meaning:
- 🟢 Active — fully provisioned (example: 3)
- 🔴 Error — encountered provisioning errors (example: 0)
- ⚫ Draft — (draft mode) provisioning not performed, parameters not completely entered (example: 1)
- ⚪ Designed — planned or designed but not provisioned, parameters completed, ready to be provisioned (example: 4)
How to use
- Use this panel when planning deployments or troubleshooting provisioning failures.
- Click "See all Resources" to view full provisioning inventory in Global Inventory.
Common actions and workflows
Drill down to problem resources
- Open the resource details page or Activity & Logs to review logs/recent events.
Review provisioning progress
- From the Provisioning status panel, click "draft" or "designed" to see items in planning and schedule provisioning as needed.
- Investigate any "error" entries to view error messages in the workflow execution panel of the resource.
Jump to service categories
- Use Quick access to jump to a category (e.g., Virtual Network Edge) and view all related resources/configuration.
Interpreting counts and the bars
- Counts are numeric, reflecting resources per status.
- Segmented bar above counts is proportional — longer segments indicates larger share of total resources.
- Totals at top of each panel show total monitored resources for that view.
Tips and best practices
- Prioritize remediation of "down" and "error" items first.
- Use "See all Resources" to export, sort, or apply advanced filters.
- Regularly review "designed" and "draft" items to keep provisioning pipelines up to date.
Troubleshooting
If you think data on the page seems stale or incorrect:
- Refresh the page (browser refresh).
- Confirm you have permissions to view all resources (some counts may be role-restricted).
- If a resource stays "down" after troubleshooting, escalate to the Orange Business support/ops team and attach resource logs.
FAQ
- Q: What's the difference between "Operational" and "Provisioning" status?
- A: Operational status reports runtime health (up/down/degraded). Provisioning status reports lifecycle stage (designed, draft, active, error).
- Q: Where do I see the full list of resources
- A: Click "See all Resources" in either panel.